Njord Project
Build an awesome drone from scratch
Server
Up to now, articles focused essentially on drone, but do not forget we have to implement a server. Today development of the server is almost completed. To get started with gyroscope was quite difficult, then we have in parallel developed the server.
By this article, we want to present how the server works and make a short demonstration by video.
Principle
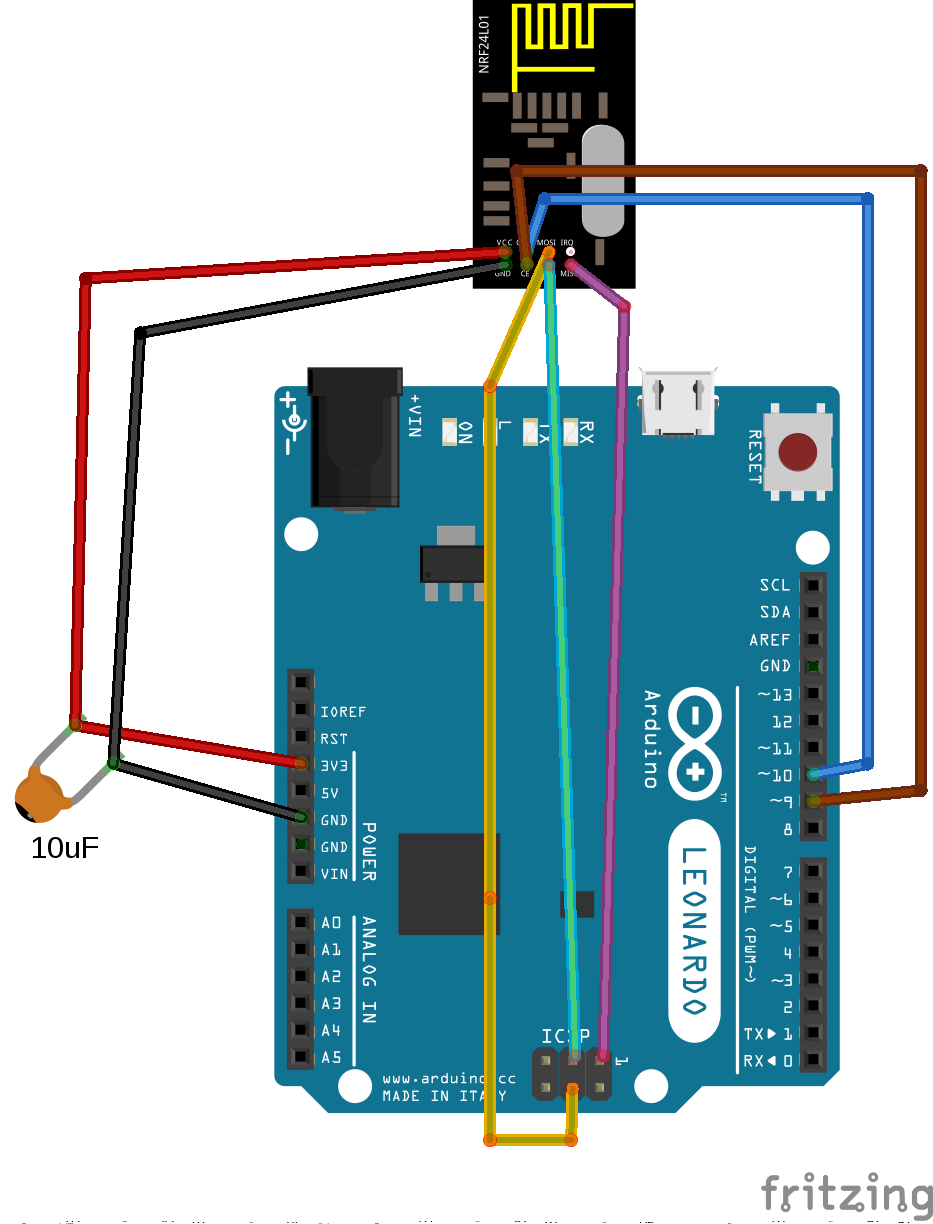
As we have already explained in radio communication, server and drones communicate with a small radio transmitter/receiver. This communication is used to collect necessary information for area's topography, know drone status, or send some instructions to drones.
Each component is associated with an address. Then, each drone knows server's address and communicates with it using this address. However, server knows a set of addresses (each drone address). And, it can communicate with each agent individually.
The server is formed with three entities. A physical one (radio component), another which stores drone's information into a database and a last entity which reads database and draws associated topography.
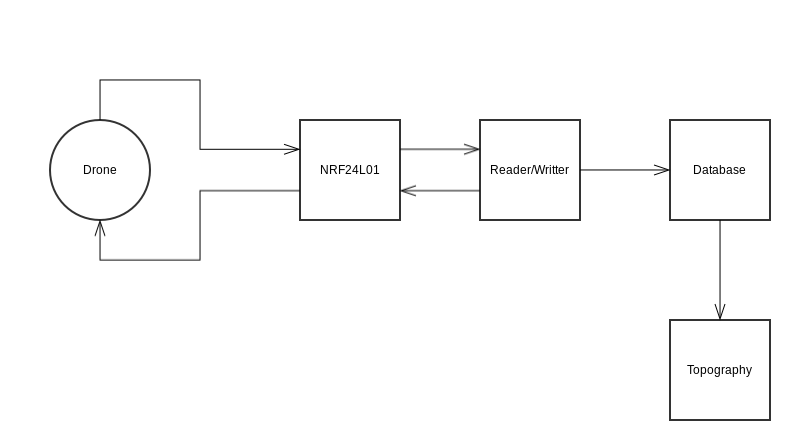
Then, we have three separated task which runs in parallel. If the server were formed with only one task, we probably miss some message due to a longer loop.
NRF24L01
The role of this task is just to read messages sent by drones and recopy them on serial port of the server. If the server wants to send an instruction to a drone, it can do it with this task. By default, radio transmitter/receiver is in reception mode. Then, server loop is just to read received messages. But if the task Reader/Writter writes on serial port, then the server will switch on transmitter mode for a short moment in order to send the instruction to the corresponding drone.
Reader/Writter
The role of this task is to simply reads and writes on serial port. By default the server reads continually port's content and adds each message in database. If an instruction has to be sent to a drone, then the server will write it on serial port and NRF24L01 will send the instruction.
Topography
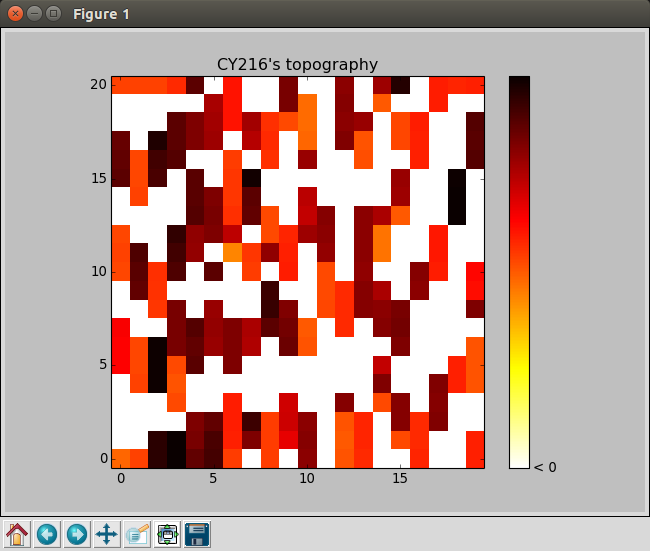
Loop's principle of this task is to read the first record of database (which is similar to a queue). Afterwards, it adds this data in a matrix which represent the studied area. Because we do not know in advance the area's size this matrix is often resized. Then, matrix's content is drawn on the server's screen.
For example if a drone send [10, 12, 130]. It means that (10, 12) element of the matrix is 130. Therefore, matrix's indexes represent point coordinates and the value represent distance between drone and what is under. Then, the draw is a set of points of various colors. The colors are different depending on the value of matrix's components.
Implementation
Here is the code of the first task:
#include
#include
#include

#define NB_DRONE 1

Communication com(8, 10);
bool ok;
uint8_t msgDrone[11];
uint8_t lenMsgDrone = sizeof(msgDrone);
int i = 0;

void setup() {
	Serial.begin(9600);
	ok = com.initRadio();
	delay(1000);
	if(!ok) {
			Serial.println("Init error");
	}
}

void loop() {
	//For each drone write on serial port received message
	for(i = 0; i < NB_DRONE; i++) {
			ok = com.receiveMsg(msgDrone, lenMsgDrone, i + 1);
			if(ok) {
  				Serial.print("d:");
  				Serial.print(msgDrone[0]);
  				Serial.print(";x:");
  				Serial.print(msgDrone[1]);
  				Serial.print(";y:");
  				Serial.print(msgDrone[2]);
  				Serial.print(";z:");
  				Serial.print(msgDrone[3]);
  				Serial.print(";s1:");
  				Serial.print(msgDrone[4]);
  				Serial.print(";s2:");
  				Serial.print(msgDrone[5]);
  				Serial.print(";s3:");
  				Serial.print(msgDrone[6]);
  				Serial.print(";s4:");
  				Serial.print(msgDrone[7]);
  				Serial.print(";s5:");
  				Serial.print(msgDrone[8]);
  				Serial.print(";s6:");
  				Serial.print(msgDrone[9]);
  				Serial.print(";msg:");
  				Serial.println(msgDrone[10]);
			}
	}
	delay(400);
}
Because this task acts on NRF24L01, it is developed with Arduino language. It reads messages from each known addresses and writes it on serial port.
You can notice that for the moment it cannot send instruction to a drone. It should be done afterward.
Now, lets take a look to the second task:
import serial
import redis
import sys

r = redis.StrictRedis(host='localhost', port='6379', db=0)
arduino = serial.Serial('/dev/ttyACM1', 9600)

while True:
		msg = arduino.readline()
		msg = [int(m.split(':')[1]) for m in msg[:-2].split(';')]
		print msg
		r.lpush(sys.argv[1], msg)
We have chosen to use Python for simplicity reasons. Database is a Redis client. Those databases are really simple to use. And, we do not want to use complex requests as SQL offers. Then, Redis is the perfect tool.
As you can see, program simply reads serial port contents and recopy it in a Redis list. As the previous task, function for sending instruction has not been developed yet.
And to finish the implementation par, this is the last task:
#!usr/bin/python3.4
#-*-coding:utf-8-*

import matplotlib.pyplot as plt
import numpy as np
from matplotlib import cm
import redis
import sys

name_area = sys.argv[1]
r = redis.StrictRedis(host = "localhost", port = 6379, db = 0)

data = np.zeros([0, 0])

fig, ax = plt.subplots()
cax = ax.imshow(data, cmap = cm.hot_r, origin = "lower")
ax.set_title(name_area + "'s topography")
cbar = fig.colorbar(cax)
cbar.ax.get_yaxis().set_ticks([])
cbar.ax.text(1.2, 0, "> 0", ha="left", va="center")
cbar.ax.text(1.2, 0.5, "150", ha="left", va="center")
cbar.ax.text(1.2, 1, "< 300", ha="left", va="center")
ax.patch.set_facecolor('white')
plt.show(block = False)

#Read from redis list and add to plot each new value available
while True:
	e = r.blpop(name_area)[1][1:-1].replace(' ', '').split(',')
	e = [int(i) for i in e]
	if(e[1] > data.shape[0]): #We need to resize the matrix
		tmp = np.zeros([e[1], data.shape[1]])
		tmp[0:data.shape[0], 0:data.shape[1]] = data
		data = tmp
	if(e[2] > data.shape[1]):
		tmp = np.zeros([data.shape[0], e[2]])
		tmp[0:data.shape[0], 0:data.shape[1]] = data
		data = tmp
	if e[3] - e[9] < 0: #If distance > Max distance
		data[e[1] - 1, e[2] - 1] = 0
	else:
		data[e[1] - 1, e[2] - 1] = e[3] - e[9]
	cax = ax.imshow(data, cmap = cm.hot_r, origin = "lower", interpolation = "nearest")
	plt.draw()
This program connects on the same Redis client as the previous task, in order to read what it has been inserted in. The part upper to the loop concern plot and matrix initialisation. At the beginning the matrix is a zero-matrix of null size. Into the loop, this task reads the content of the Redis queue and adds each entry in the matrix (resizes it if necessary) and draws the matrix's content in the plot.
The former condition is necessary for a simple reason. The maximum distance measured by our ultrasonic sensors is up to five meters. Beyond this value, sensor return infinite value. In this case, the distance between drone and what it is under will be negative. Then, we have to fix this value to 0 in order to keep consistency in our plot.
Regarding the plot, we chose to use MatPlotLib library because it is simply to use and widespread among the Python community.
Demonstration
To get finish with this article, this a short video showing real-time running of our server. But please note that we are still unable to locate our drone in space, then we sent non-real position to the server.